See the Service.
Own the API.
Wag-Tail Lighthouse is an OpenTelemetry-native service operations portal. It auto-discovers your services, shows ownership and API-level health, and turns alerts, traces, and logs into one investigation path — on the Tempo, Mimir, and Loki stack you already run. Click into the failure, not across five tools.
Telemetry Is Abundant. A Control Plane Is Not.
Tempo, Mimir, Loki, and Grafana collect and store every trace, metric, and log line. But operators still lack a living inventory of what is running, who owns it, which API route is failing, and a guided path from symptom to evidence. Lighthouse is the control plane on top of the telemetry you already have.
Telemetry Plane — What You Already Run
Collects and stores the raw signals:
- Tempo — distributed traces
- Mimir — metrics & golden signals
- Loki — logs at scale
- Grafana — explore & dashboards
Control Plane — What Operators Still Need
Turns signals into ownership and action:
- Living service & API inventory with ownership
- Route-level health, not only service red / green
- Alerting with maintenance windows & channels
- One click path from symptom to evidence
The Challenge: Telemetry Without an Operator Portal
Three gaps that show up on the on-call roster — and on the P&L.
Invisible Inventory
Ownership, team, and criticality live in spreadsheets or tribal knowledge. New services reach production before they reach any owned list.
Service-Level Is Too Coarse
A red service doesn't say which API, edge, or span failed. Latency incidents hide behind error-only filters, and host pressure is disconnected from app health.
Investigation Friction
On-call jumps between Explore, traces, and logs with no guided path. Alerts fire after users feel the outage, and reading raw logs is slow.
Emit. Collect. Control. Act.
OpenTelemetry from your gateways, services, integrations, and batch jobs flows through the Collector into Tempo, Mimir, and Loki. Lighthouse sits on top as the control plane — then reaches the right owner on the right channel.
Emit & Collect
API gateways, Spring Boot, Apache Camel & batch jobs → OpenTelemetry Collector → Mimir · Loki · Tempo
Wag-Tail Lighthouse
- API golden signals per route
- Service, host & OS health
- Custom metric rules
- Silence windows & expiry checks
- Maps, traces & live log tail
- Saved queries & AI assist
- OIDC single sign-on & RBAC
- MCP for AI extensibility
Reach & Act
Email · Teams · Slack · SMS · Webhook — routed by workspace and team to the owner who can fix it
Four Outcomes for IT Leadership
Ownership clarity, trusted detection, and faster time-to-root-cause — without adding a second observability product.
Inventory You Can Trust
Auto-discovery from OpenTelemetry resource attributes. Ownership, team, criticality, and workspaces for every service and API route.
API-Level Health
Golden signals per route — rate, errors, latency — plus host and OS metrics (CPU, memory, disk, process) where it matters.
Alerting That Respects Calendars
Custom metric rules, silence windows, certificate and domain expiry — delivered to Slack, Teams, SMS, webhook, or email.
One Investigation Path
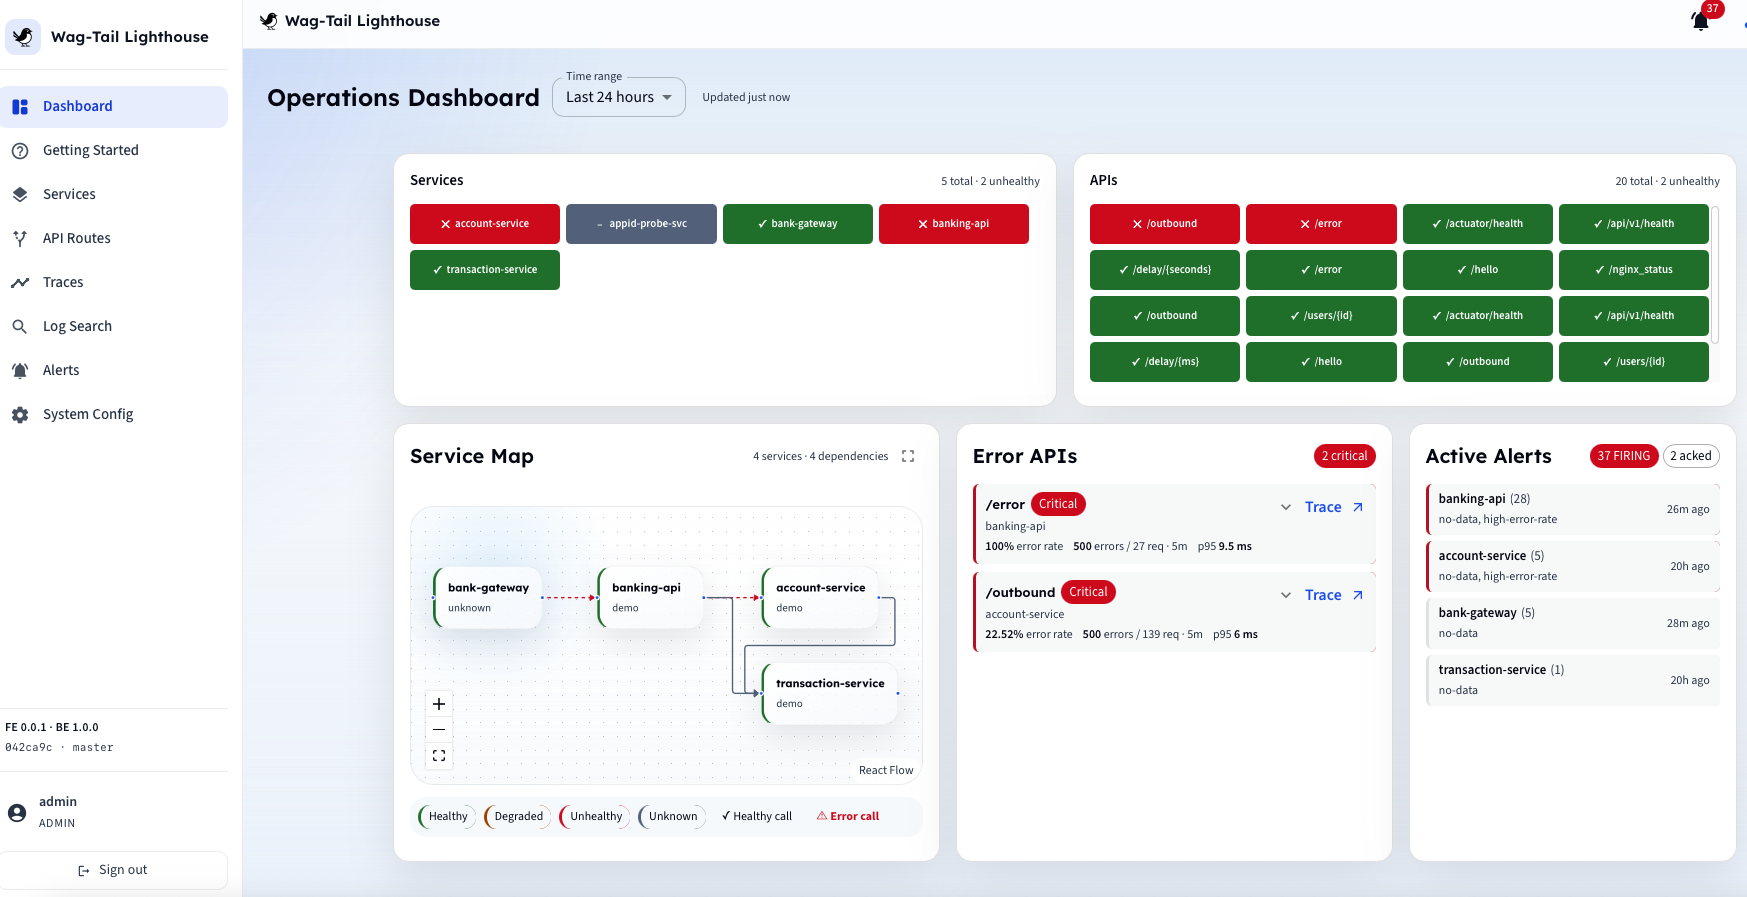
Dashboard or alert → unhealthy API → root-cause panel → traces, live tail, saved queries, and AI assist.
From Issue to Evidence — In the Product
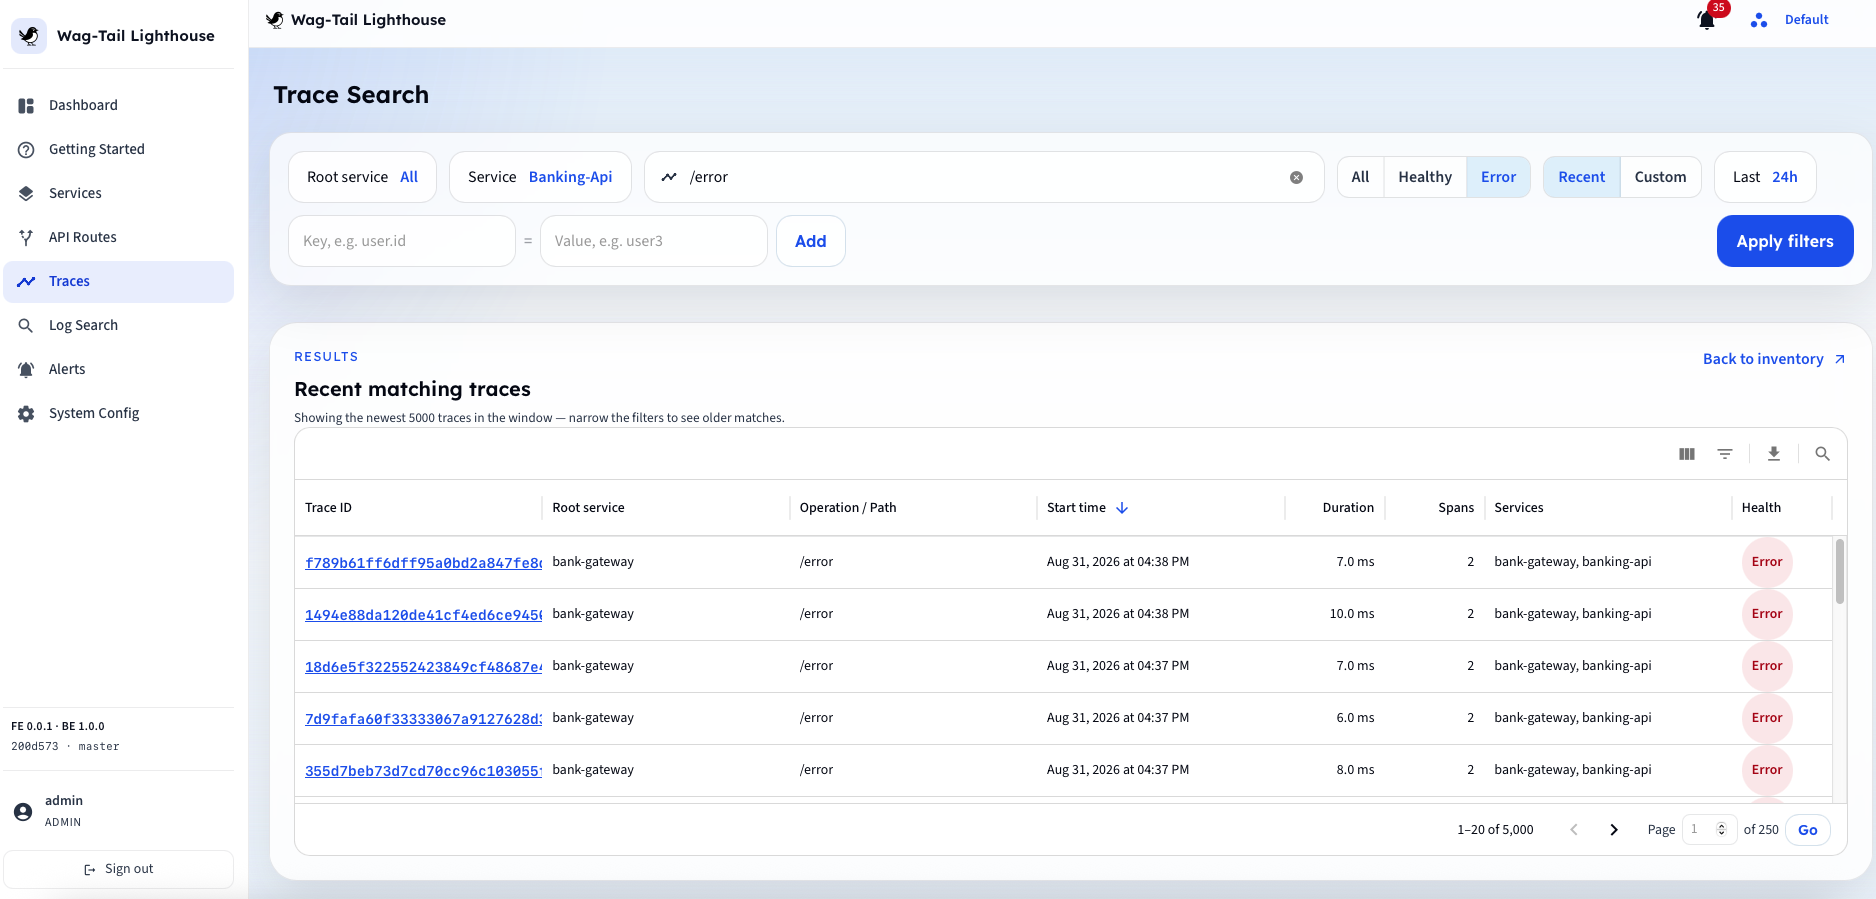
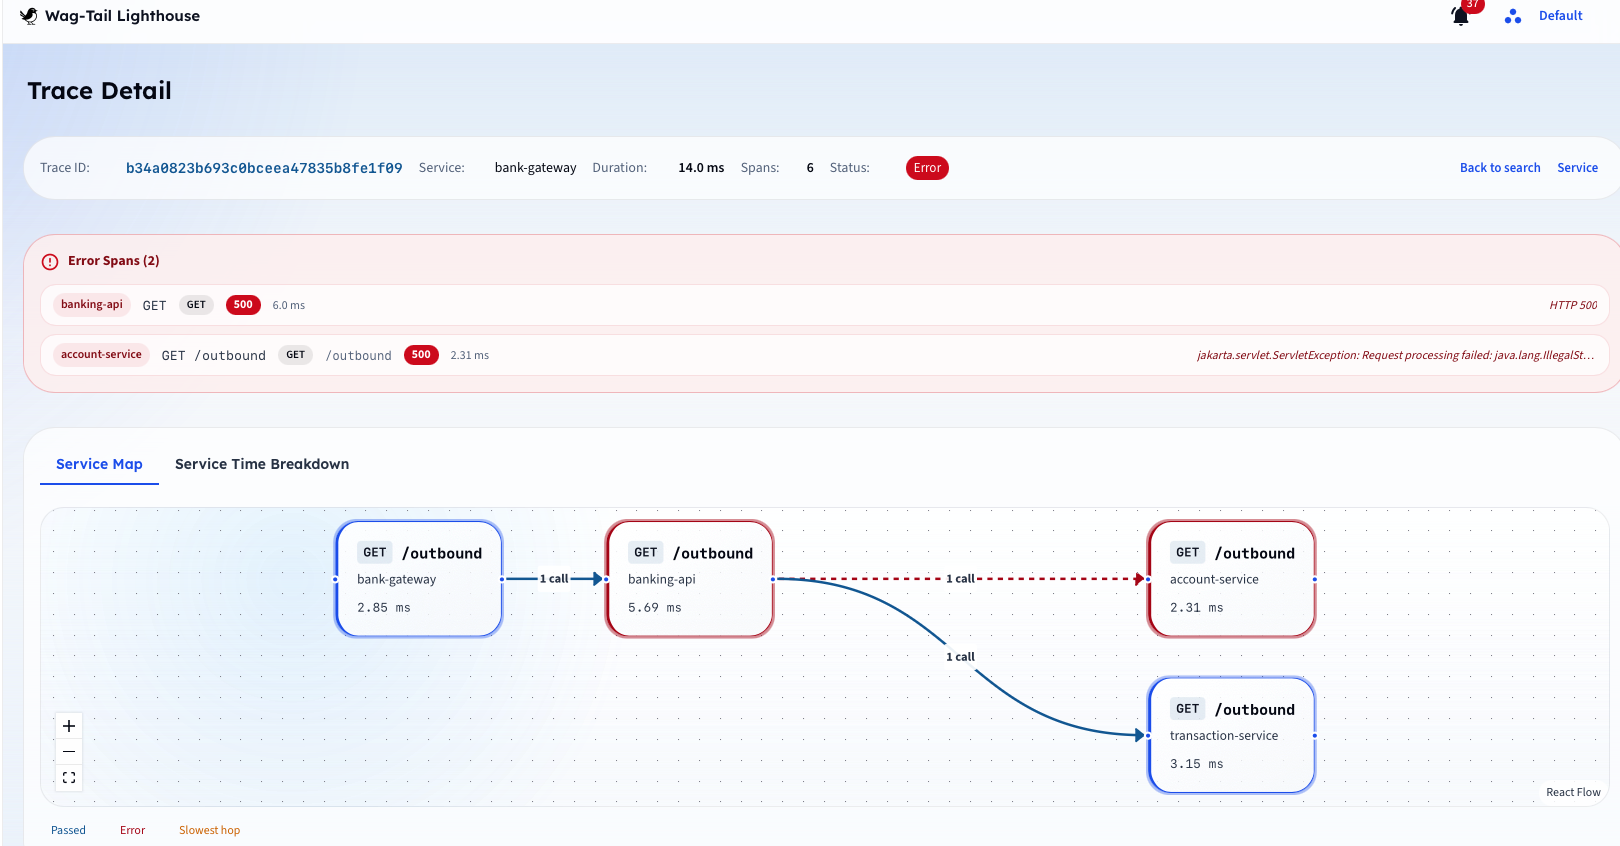
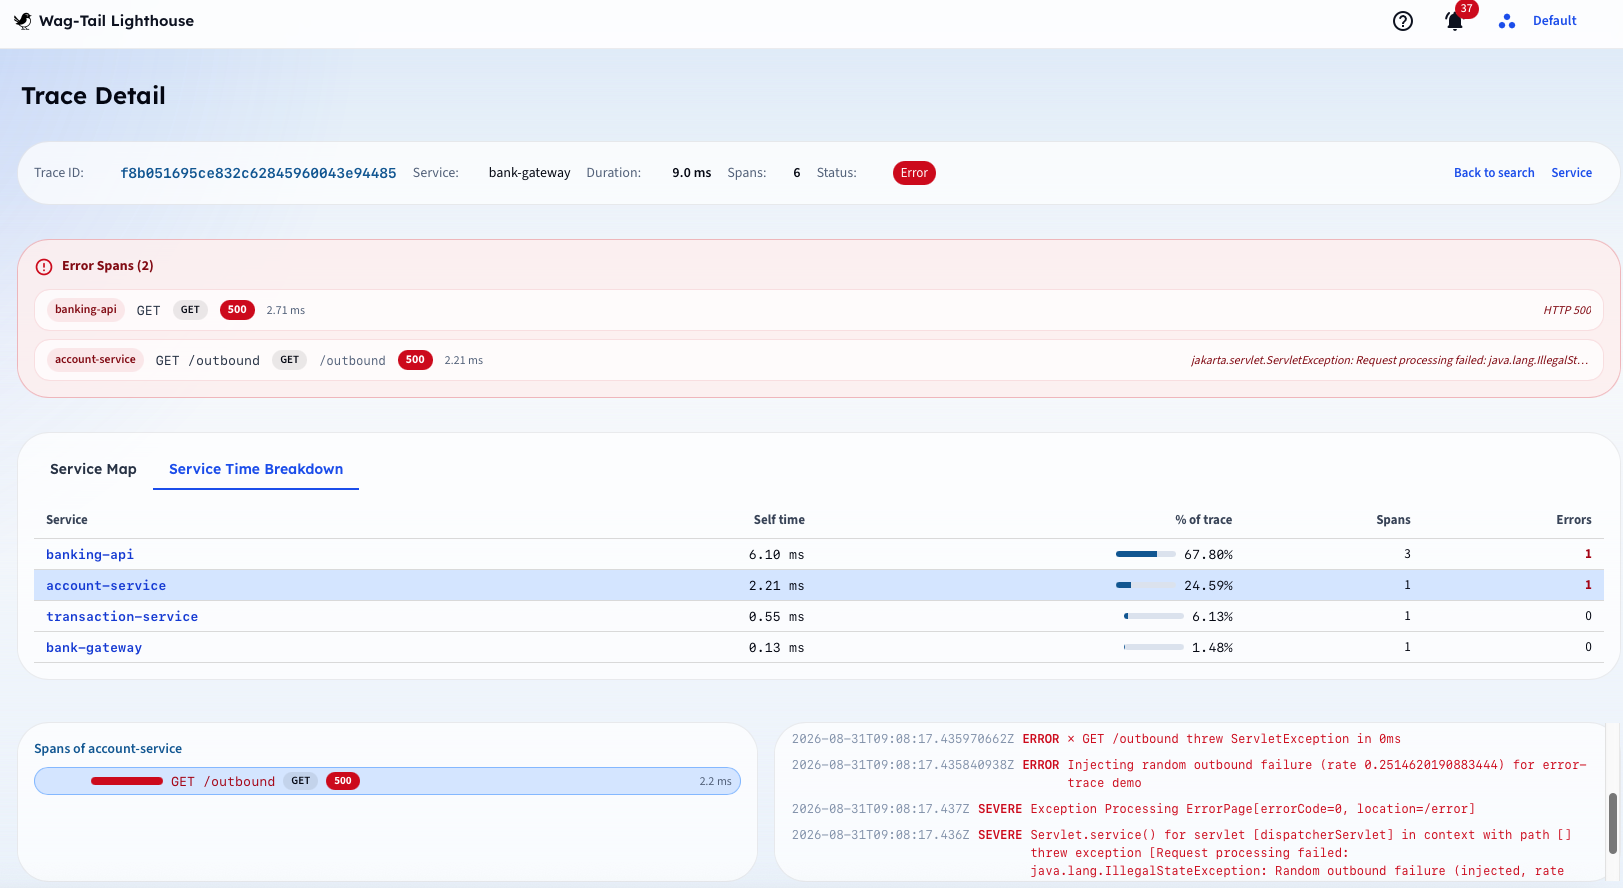
Real Lighthouse views: start on the operations dashboard, drill into the failing traces, and land on the exact log lines behind the error.
One Investigation Path
From an unhealthy API route or a failed batch job to remediation — without tool hopping.
1. Symptom
Unhealthy API route or failed batch job
2. Scope
Rate, errors & latency for that route
3. Compare
Healthy vs failing traces, side by side
4. Evidence
Live log tail in trace context
5. Share
Saved query with a shareable URL
6. Assist
AI hypotheses & next steps
7. Act
Remediate & notify the owner
Deep Investigation Toolkit
Stay on the evidence — live, shareable, comparable, and AI-assisted.
Live Log Tail
Follow production logs in real time from the same investigation context — no separate Explore tab hunt.
Saved Queries & URLs
Persist filters and share deep links so the next responder lands on the same view in one click.
Trace Comparison
Diff healthy vs failing traces side by side to isolate the regression without guesswork.
AI Log Analytics
AI on Loki search and trace-correlated log lines — guided hypotheses and next steps, with a cited trace.
Proactive Owner Email
Threshold and baseline alerts reach the owner before users feel the impact — act on degradation, not downtime.
OS Host Telemetry
OpenTelemetry for CPU, memory, disk, and process — know whether the app is sick or the host is saturated.
Same Collector. Same portal. Same investigation path. Every capability extends a Lighthouse surface — none of them require a second observability product.
Built for Integration Platforms
API gateways, Spring Boot services, Apache Camel routes, and Spring Batch jobs are where API, integration, and batch failure modes meet. Prove Lighthouse there — then standardize the same path across your wider estate.
API Gateway
- High error rate on a single route
- Latency spike on a payment path
- Rate-limit and security events
Spring Boot & Camel
- Service-to-service request spans
- Camel routes to IBM MQ, Kafka & SFTP
- Downstream Oracle / MySQL calls
Batch & Scheduler
- Spring Batch & Quartz job status
- Duration against SLA
- Success / failure with history
From Monitoring to Business Confidence
What operations and leadership gain when every service runs through one control plane.
Higher Reliability
Fewer unplanned incidents — degradation is caught while the trend is still recoverable.
Lower MTTR
Gateway → trace → log in one path, so responders resolve issues faster.
Better User Experience
Stable, performant APIs for the customers and partners who depend on them.
Operational Efficiency
Data-driven batch operations and on-call, with noise kept out by silence windows.
Clear Ownership
Every service and API route has an owner, criticality, and workspace — not a spreadsheet.
Enterprise Ready
OIDC single sign-on, RBAC, and MCP extensibility on an open OpenTelemetry foundation — no lock-in.
Foundation: OpenTelemetry-native, built on Tempo, Mimir, and Loki — Lighthouse adds the control plane without replacing the telemetry stack your teams already operate.
Ready to go from alert to root cause in one path?